Last week I had the opportunity to present “Data Visualization With Web Standards” to the Data Visualization New York Meetup group. There was a great turnout, and thanks to everyone who attended. I’d like to especially thank Christian Lilley and Paul Trowbridge for organizing the event.
My presentation focused on the fundamental techniques of visualizing data within HTML/JS experiences. You can view my presentation in its entirety below. Slides and bullet points are below the fold…
Entire meetup video available here.
My slides are available below. Just press the space bar to advance to the next “slide”.
Key Points
Basically, there are 5 general ways to visualize data using web-standards techniques – here is a brief overview with pros & cons:
<img>
You can embed images using the html <img> that have server-rendered data visualizations. This is nothing new… They are very basic, but will certainly work.
- Not interactive
- Requires online & round-trip to server
- No “WOW” factor – let’s face it, they are boring
- Example: Google Image Charts
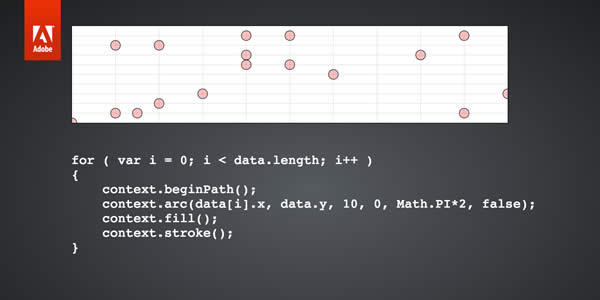
HTML5 <canvas>
You can use the HTML5 <canvas> element to programmatically render content based upon data in-memory using JavaScript. The HTML5 Canvas provides you with an API for rendering graphical content via moveTo or lineTo instructions, or by setting individual pixel values manually. Learn more about the HTML5 canvas from the MDN tutorials.
- Can be interactive
- Dynamic – client side rendering with JavaScript
- Hardware accelerated on some platforms
- Can work offline
- Works in newer browsers: http://caniuse.com/#search=canvas
Demos:
- Rgraph – Open source charting library using HTML5 <canvas>
- “One Million Points” Scatter Plot – Let the page load, then use the mouse to click and drag regions to “drill into”. This is a live visualization that shows a scatter plot with a histogram for massive data sets by manipulating individual pixels.
- Gun Killing Visualization – Don’t hate me for the content – I like the visualization, but want to stay out of the politics of it.
Scalable Vector Graphics (SVG)
SVG is a declarative XML-based markup language that is used to create vector graphics content, and can be used to create visual content inside of web experiences.
- Client or Server-side rendering
- Can be static or dynamic
- Can be scripted with JS
- Can be manipulated via HTML DOM
- Works in newer browsers (but not on Android 2.x and earlier): http://caniuse.com/#search=SVG
Demos:
- “US Census Browser” – multi-platform PhoneGap application showing enterprise-class data visualization using web standards techniques.
- The Business of Bond – visualization of revenue generated by James Bond movies.
- D3.js data visualization framework
- Raphael.js data visualization framework
- HighCharts data visualization libarary
- Sencha Touch Charts
- Kendo UI DataViz
- G.Raphael data visualization library
HTML DOM Elements
Visualizations like interactive maps, or simple charts can be created purely with HTML structures and creative use of CSS styles to control position, visual presentation, etc… You can use CSS positioning to control x/y placement, and percentage-based width/height to display relative values based upon a range of data. For example, the following bar chart/table is created purely using HTML DIV containers with CSS styles.

Samples:
- Leaflet map engine
- Simple HTML DOM Bar/Column Charts
WebGL
WebGL is on the “bleeding edge” of interactive graphics & data visualization across the web. WebGL enables hardware-accelerated 3D graphics inside the browser experience. Technically, it is not a standard, and there is varied and/or incomplete support across different browsers (http://caniuse.com/#search=webgl). There is also considerable debate whether it ever will be a standard; however there are some incredible samples out on the web worth mentioning:
Feel free to leave a comment with any questions.
Enjoy!